- Home
- Release Notes
- DRYiCE iControl v3.1.0
DRYiCE iControl v3.1.0
RELEASE DETAILS
| Product Name | iControl |
| Version Number | 3.1.0 |
| Release Month | August , 2024 |
| Release Size (KB/MB/GB) | 13.6 MB |
The iControl product provides business context to operational events by linking applications, business units, and products to a business process flow delivering products or services to an endpoint. The following document details changes within the release (version above). There are several new features in this release as documented below.
These notes relate to major release version 3.1.0, in which over 350 development tasks delivered, and at the same time updated any underlying 3rd party component libraries required to facilitate new feature development, emove security vunerabiities, and comply with release compliance guidelines.
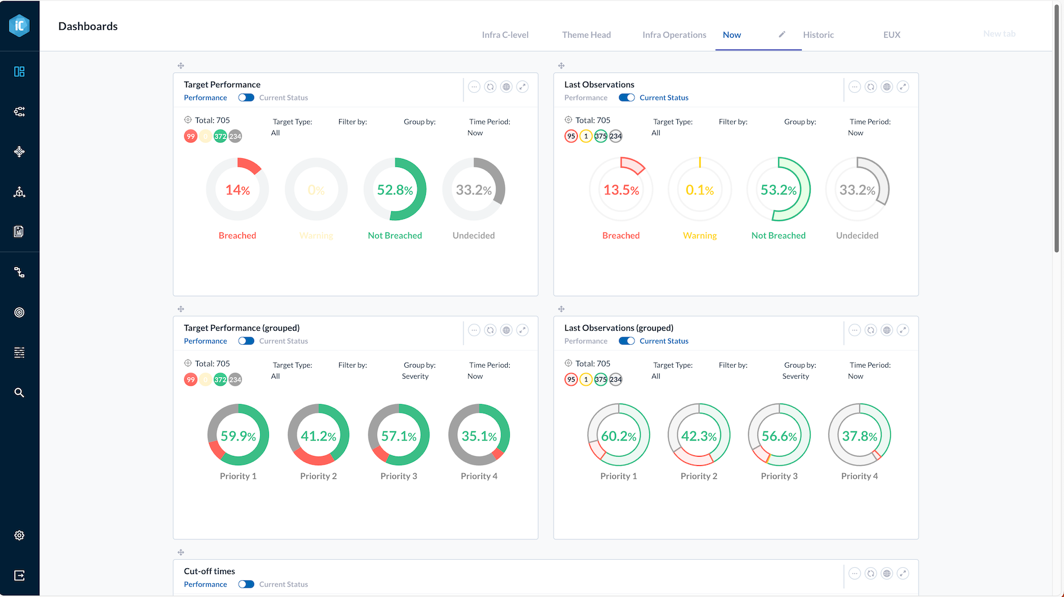
As well as over 150 ‘Bug’ fixes and improvements, these are the key features delivered within this release as follows:
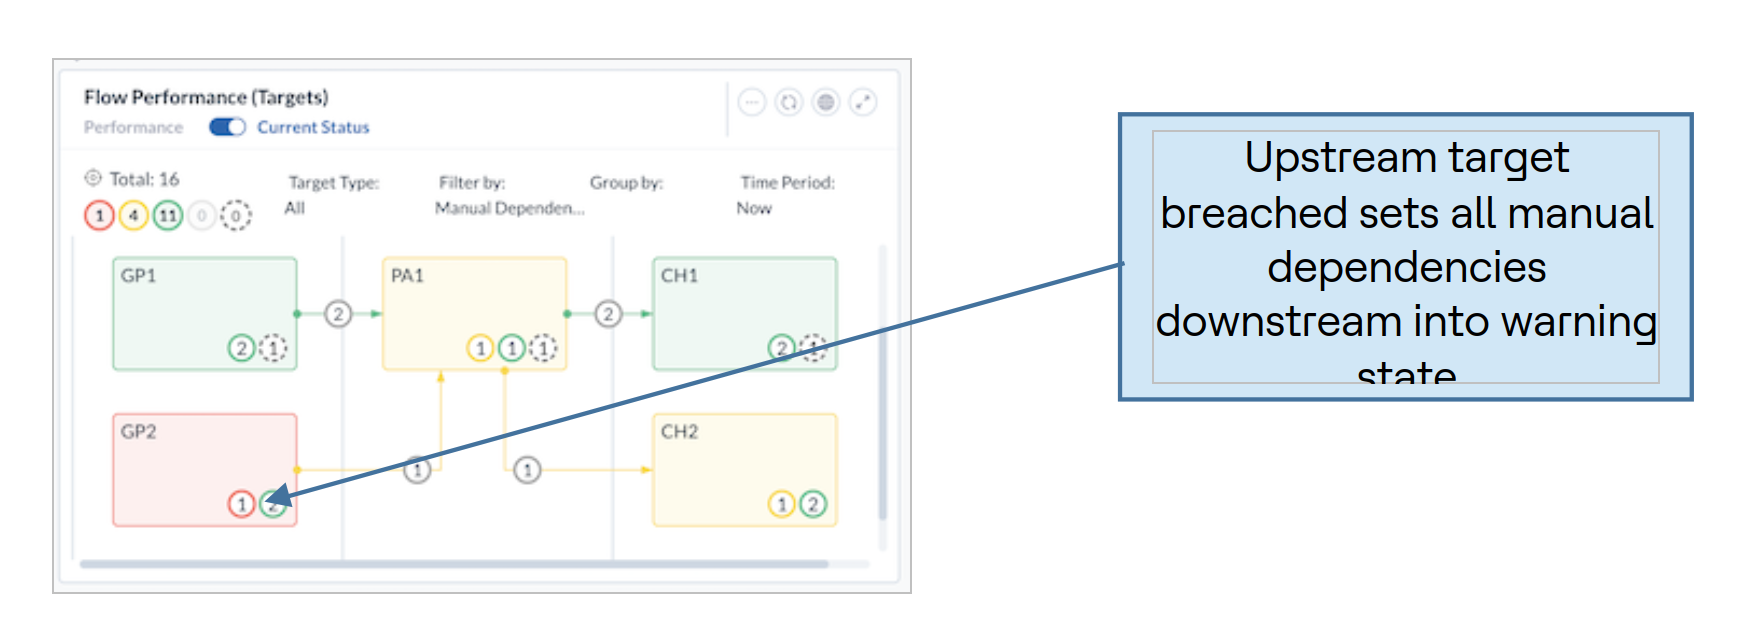
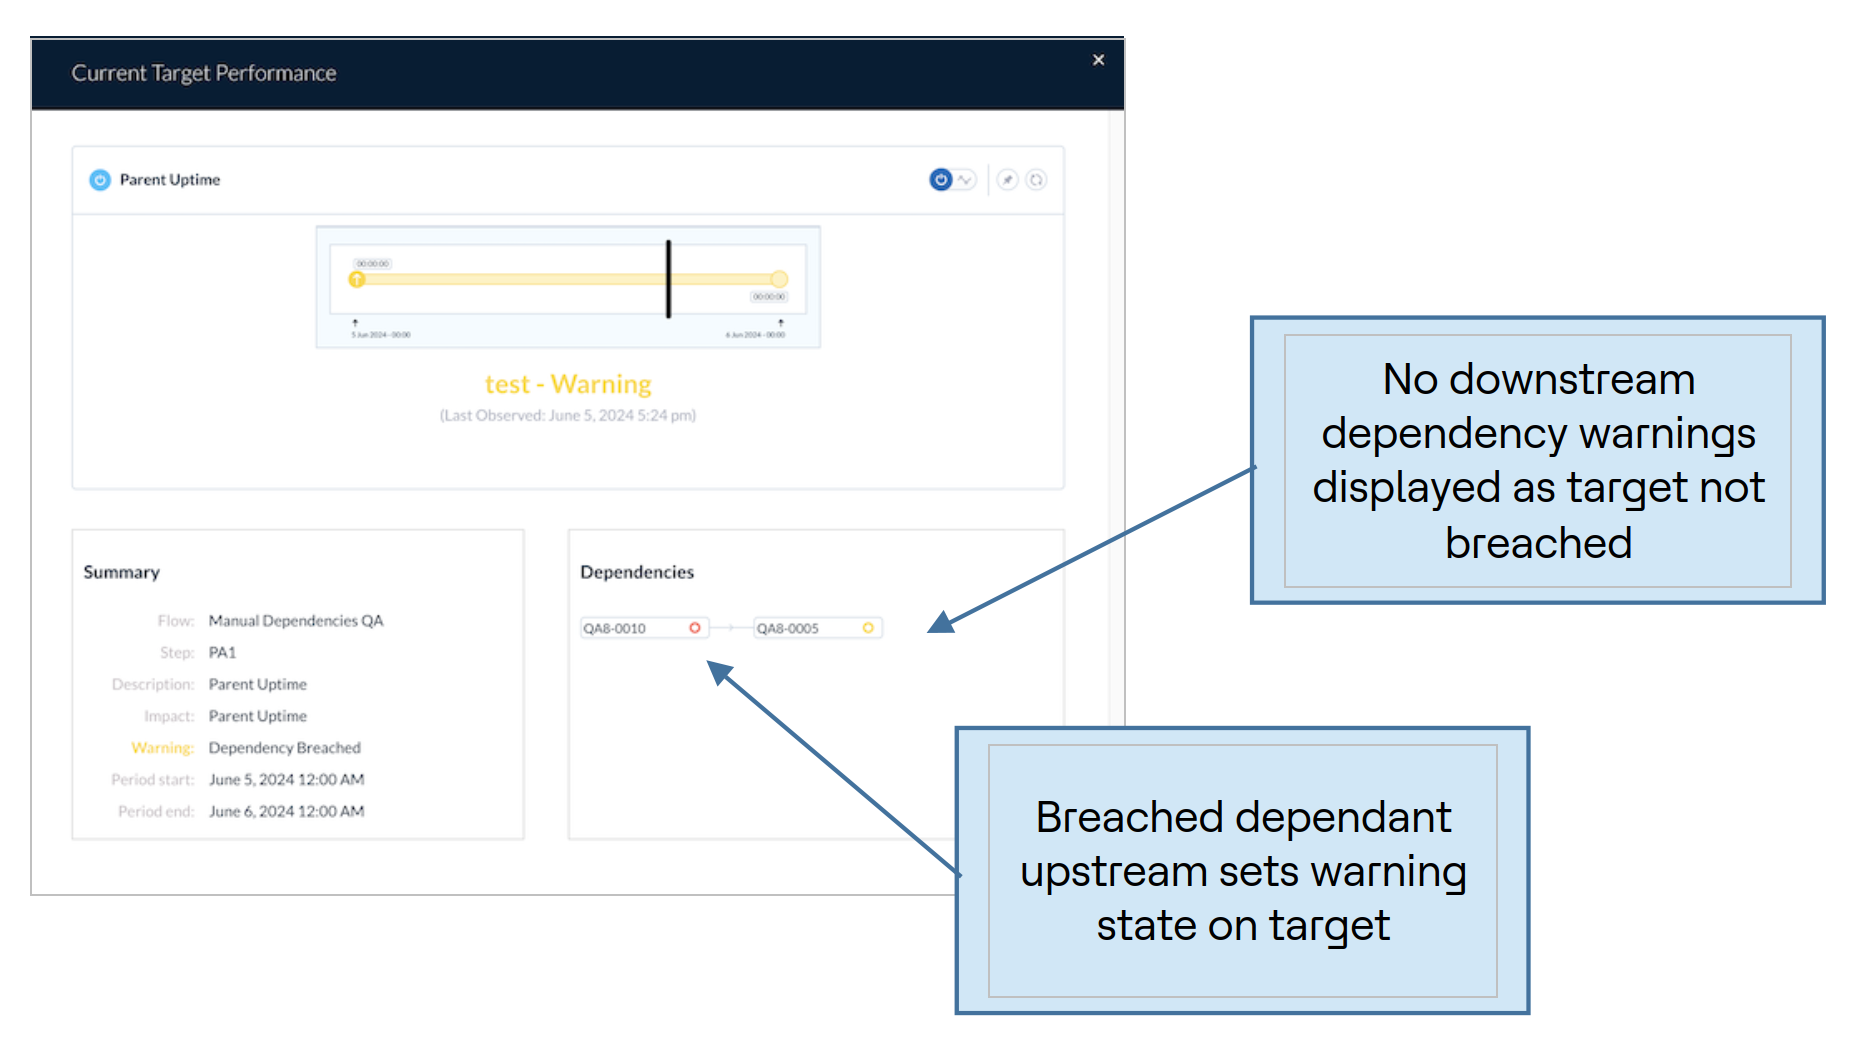
- Manual dependencies – the ability to define dependencies within a flow, on a Target Breach settings Warnings on downstream Targets manual defined within the Target details as dependant.
- Pin widget updates – the ability to define to which dashboard a widget should be pinned including the ability to add a new dashboard for the widget.
- Multiple Operator/Viewer Groups – the ability to define multiple Groups as either operators or viewers of a flow or target.
- Expose iControl data within Grafana – expose the iControl operational schema in Grafana to utilise operational status within visualisations in Grafana dashboards.
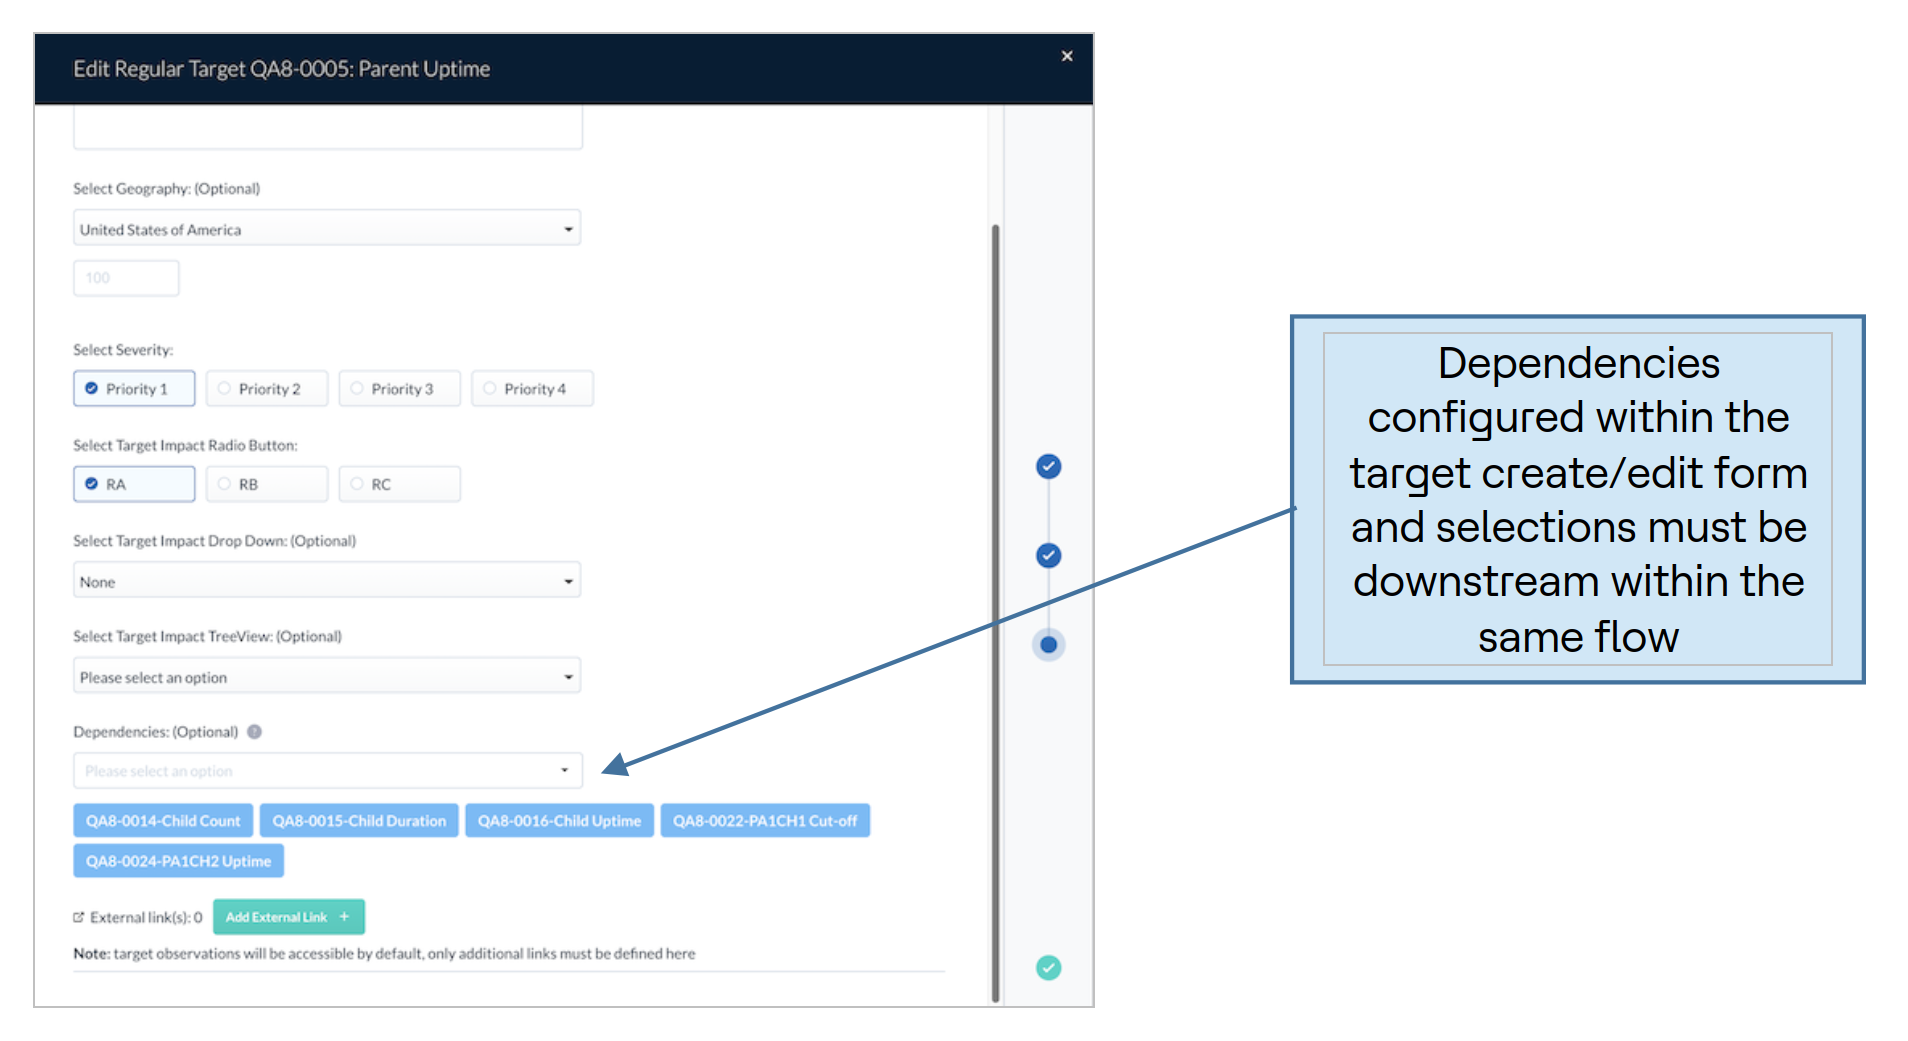
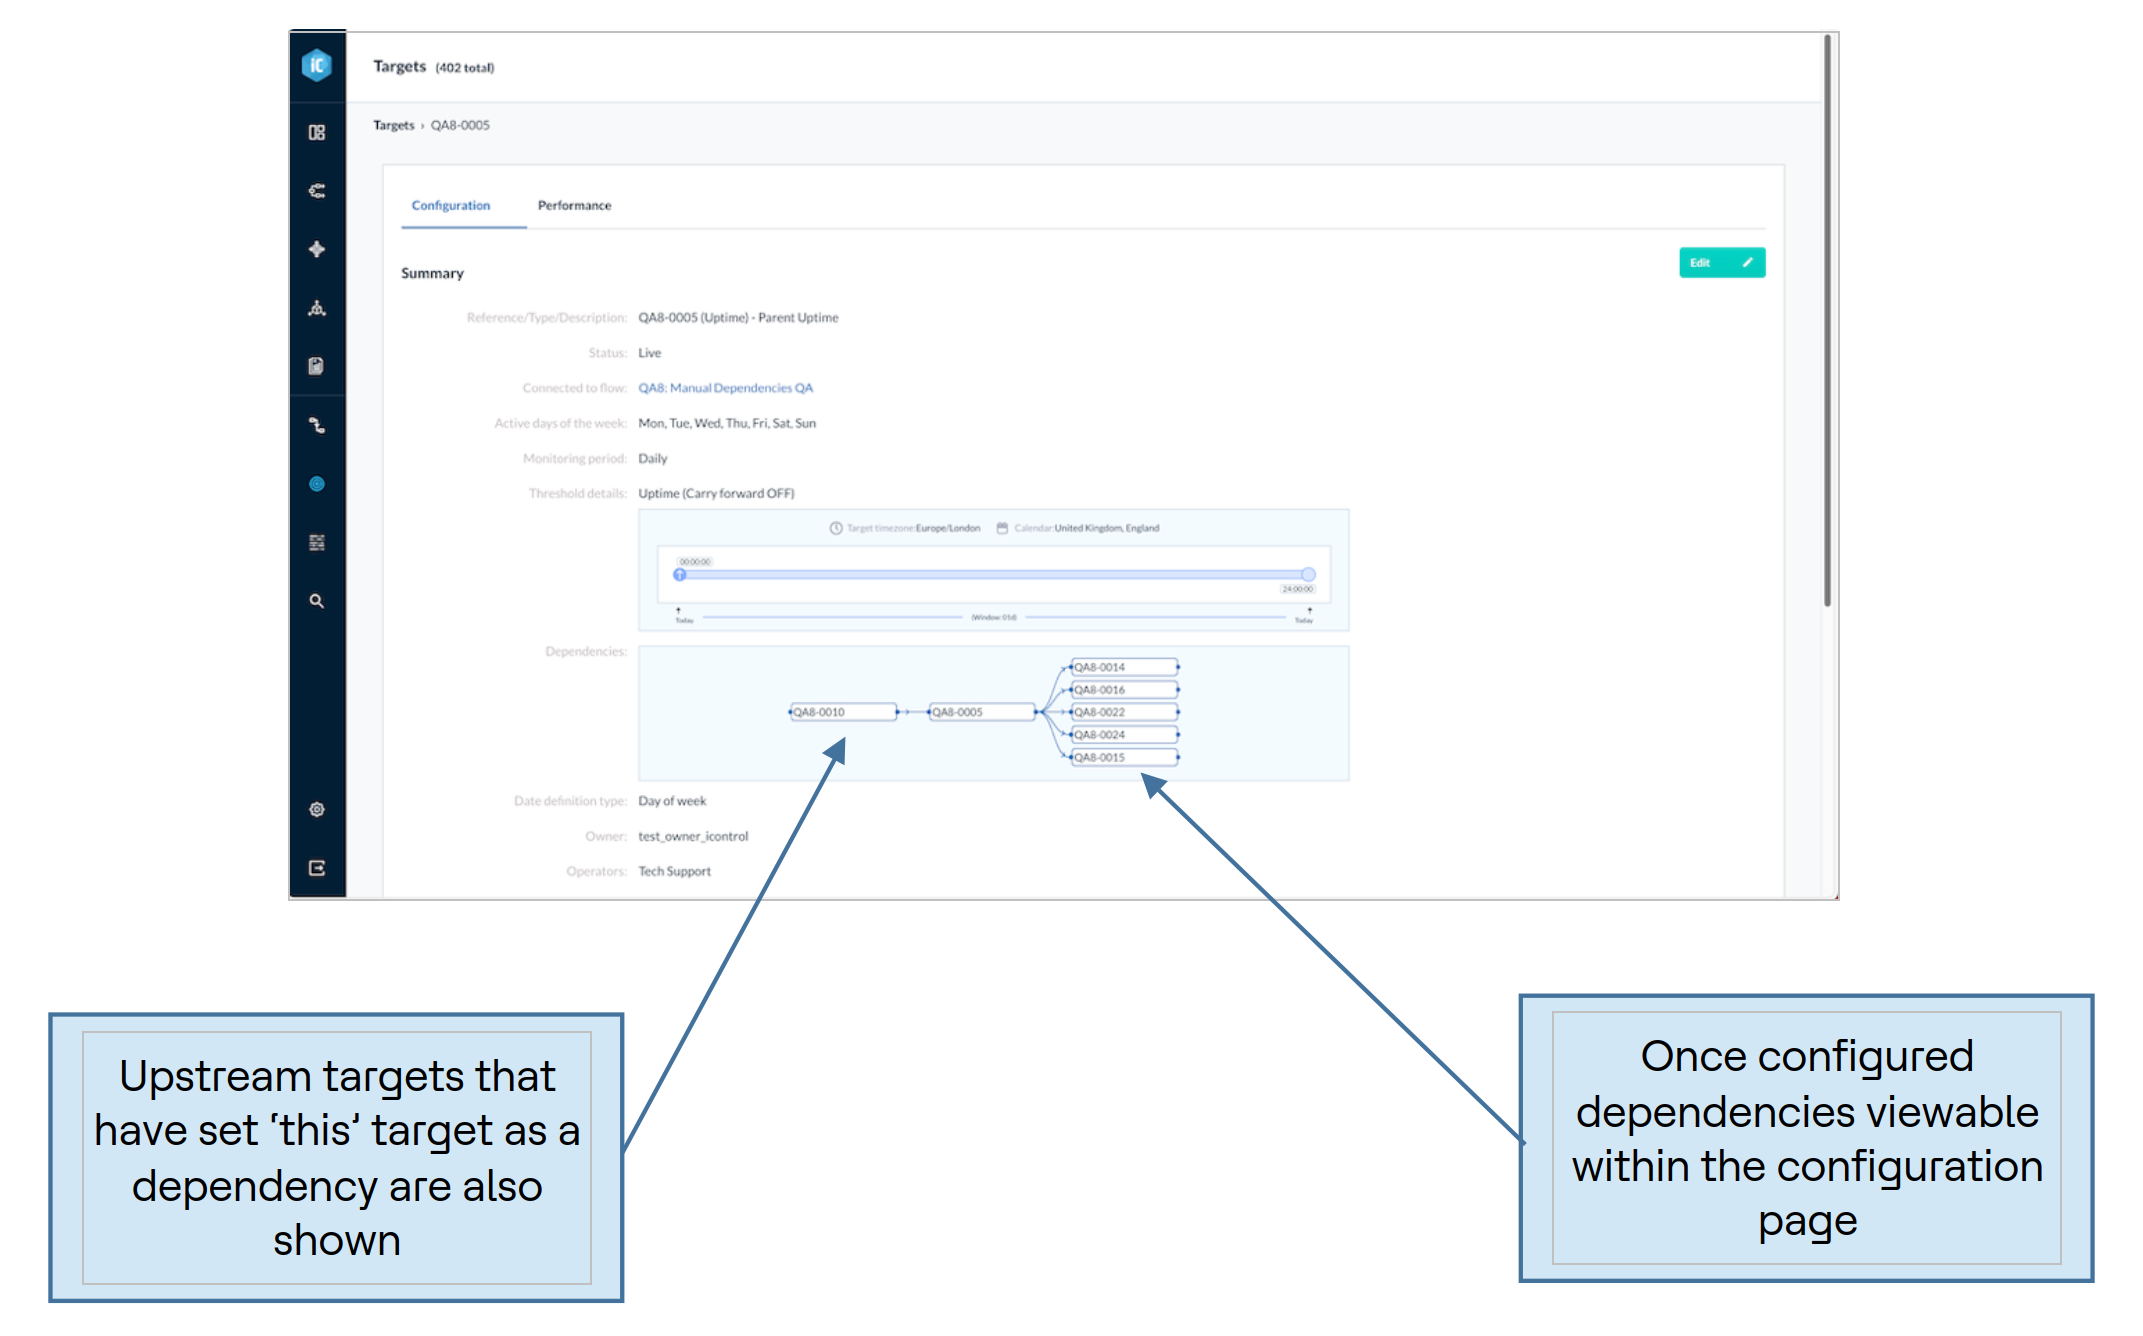
Manual dependencies allow the user to define dependant relationships between targets within a flow, whereby if target ‘a’ breaches then it can create a ‘dependancy’ warning on target ‘b’.
Manual Dependancies are configured within the target create/edit modal form (page 3) and once added viewable within the target configuration details page.
In previous versions of iControl the user had the ability to pin an observation widget to the currently selected dashboard or, if the currently selected dashboard was a ‘common’ dashboard (non-editable) then the widget would be pinned to the first/default dashboard.
For this release this feature has been extended to allow the user to both select which dashboard to pin the widget on, with the added ability to create a new dashboard for the widget.

In previous versions of iControl it was possible to allocate a flow to a single operating group, and to allocate a target to a single operating group and a single viewer group.
However, to cater for when a flow contains multiple operational units or applications, or a target must be monitored by members of multiple operating groups being either the group responsible or a group ‘dependent’ on the target performance therefore requiring visibility, this functionality has been extended to allow for the definition of multiple operating or viewing groups, and the filtering of visible targets by multiple groups.
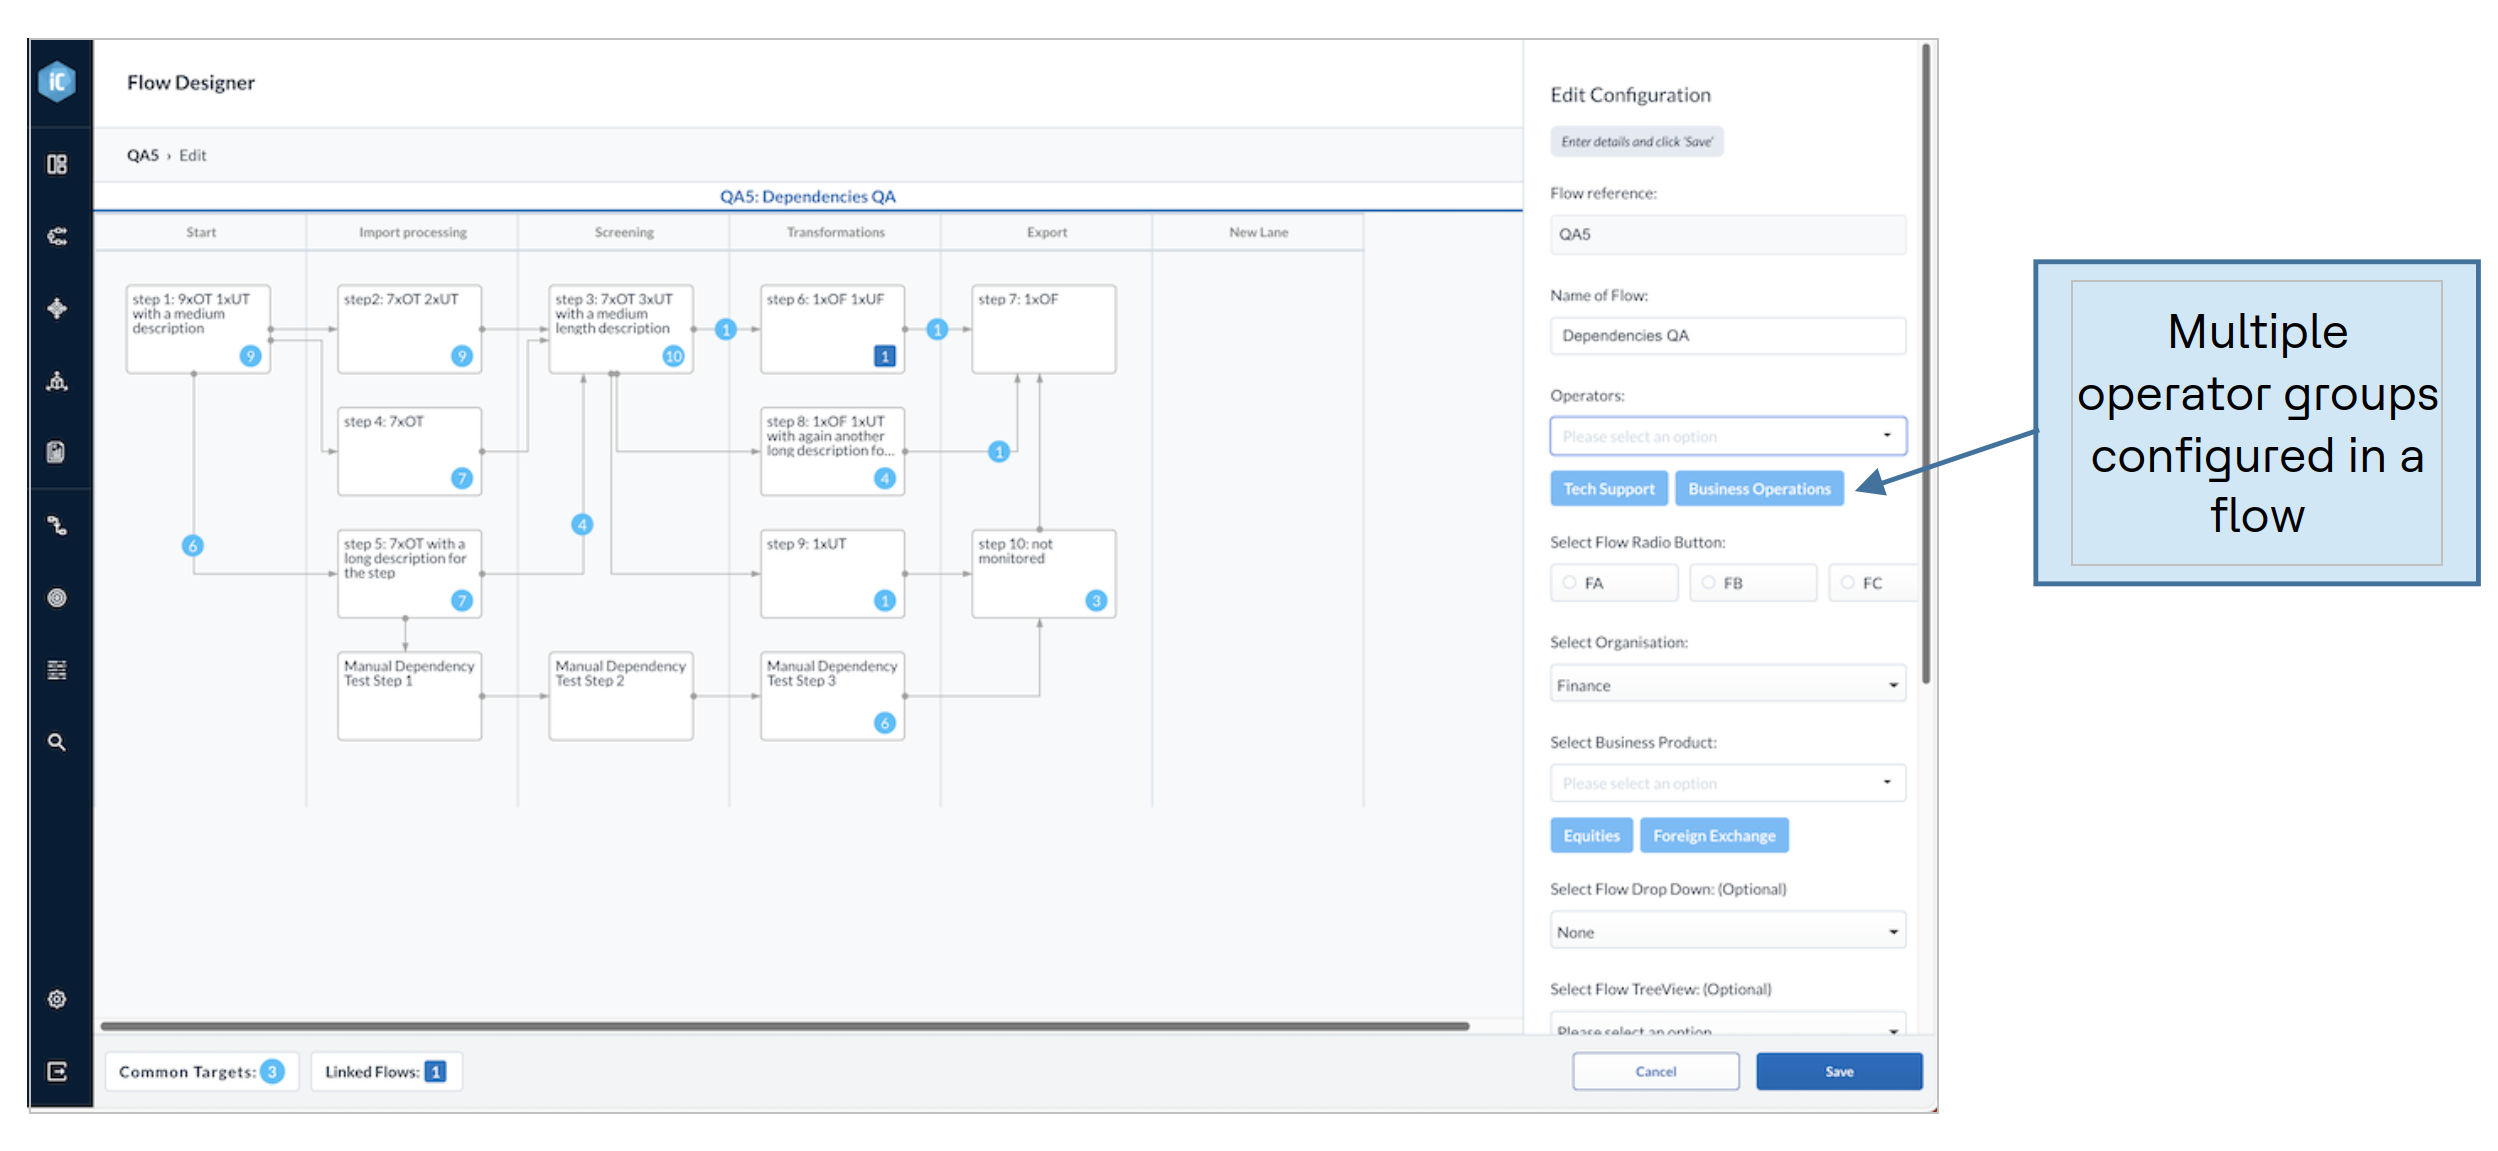
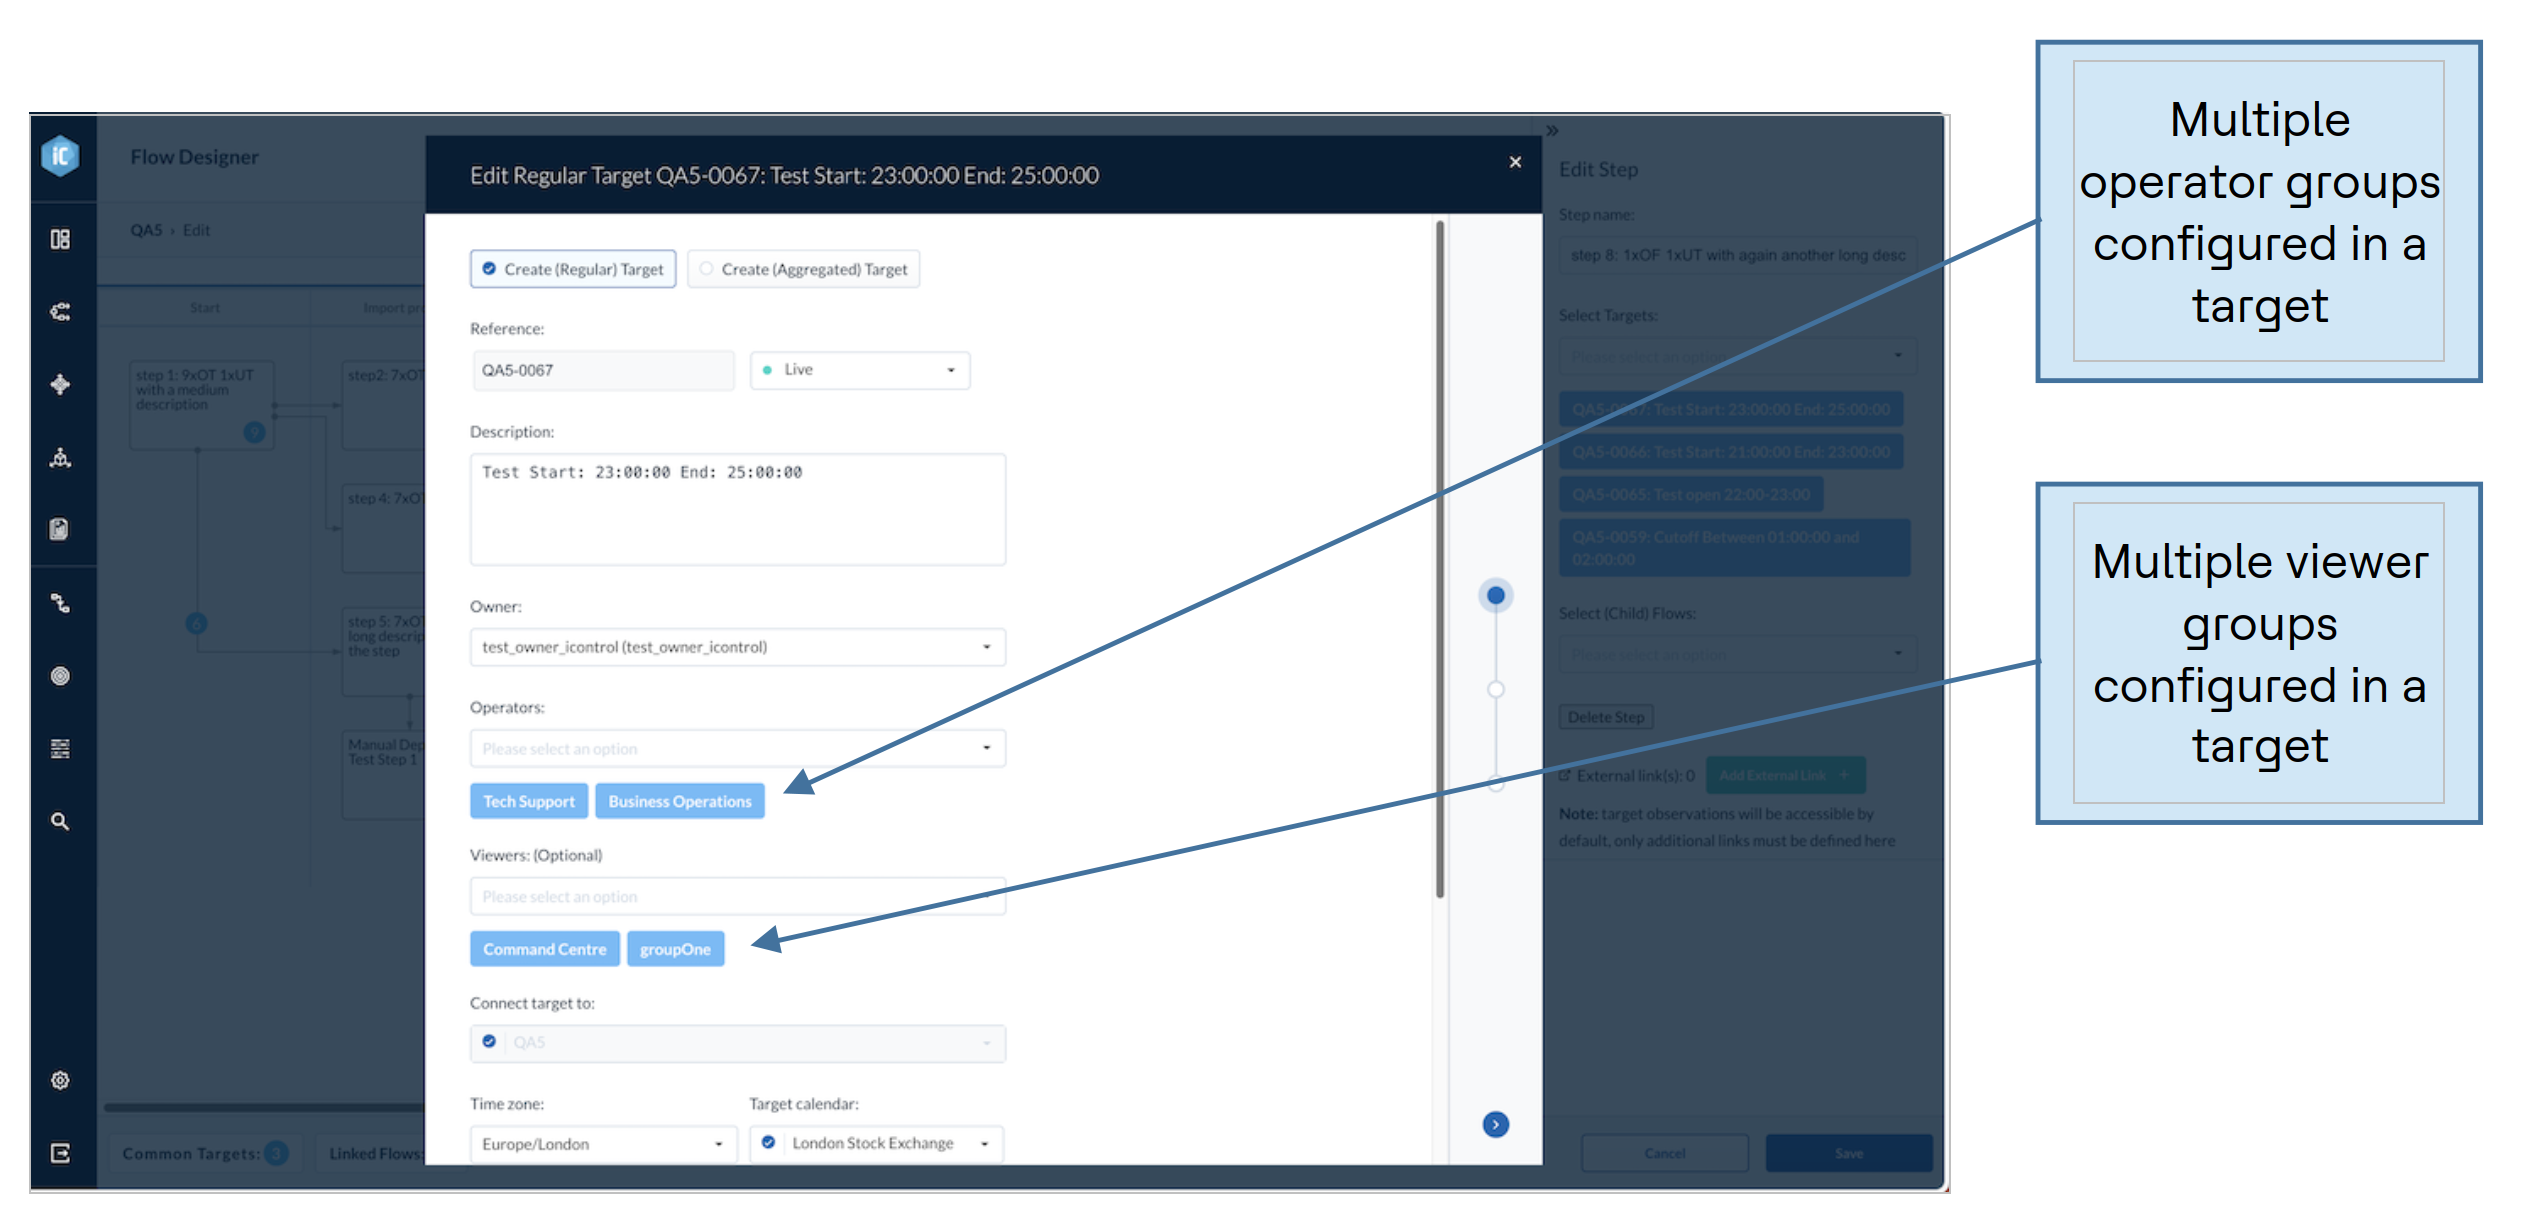
With the addition of multiple groups the following users have flow/target operational visibility:
- Superusers
- Application managers
- Application owners
- Members of any Operator or Viewer groups
To facilitate simple real-time access to operational flow and target performance data from widgets within a Grafana dashboard.
HCL iControl dependencies:
- Splunk Machine Learning Toolkit v5 (for Splunk 8 and above).
iControl is a product within the emerging market sector of Operations Intelligence – Technology solutions that leverage analytics to help end-users continuously observe and manage business operations in real-time.
iControl forms part of a combined software and services solution developed by HCL Software around “Business Process Observability” which enables its customers to observe, measure, and report on the impact of IT performance in delivering business outcomes. Today iControl is primarily used by the project teams as an implementation tool.
Business Process Observability enables end users to observe business relevant targets on a real-time basis and take informed actions accordingly. It is used by Operations technology staff on a day-to-day basis to ensure smooth running of the critical business flows to deliver end product outcomes.
Key elements of a Business Process Observability implementation are to:
- Define a visual “flow” for the end-to-end business process.
- Define service-level targets to set expected performance for key points within the flow.
- Associate these targets with metric data provided from underlying monitoring.
- Calculate real-time service-level performance and capture variance from expected levels.
- For existing customer support log on to support.dryice.ai
